Regional Antibiotics Prescribing
Are there regional differences in antibiotics prescribing? Are there consistent patterns across different years?
Back in 2012 we produced a dashboard that focussed on antibiotic prescribing levels by the regional CCG’s (Clinical Commissioning Groups – regional NHS primary care organisations, since 2022 replaced by Integrated Care Boards). This showed that there was a high degree of variability in prescribing levels between regions, and also seasonality of prescribing – and drew attention form The Guardian newspaper who featured it in an article “Antibiotics: is it time to get tough?” published on November 18, 2012. This article & our dashboard also drew the attention of the then Chief Medical Officer, Dame Sally Davis who referenced our analysis in a piece for The British Journal of General Practice in Dec 2014, as well as using images from the dashboard for presentations.
13 years later we have returned to this subject to assess if the situation has changed, and provide more in-depth analysis. This time, instead of using aggregated CCG level data we have been able to access far more granular GP practice data (approximately 17 million records published monthly by the NHS Business Services Authority), collating data since 2019. As the GP prescribing data sets only include absolute prescribing figures, we have then combined the data with GP Practice patient numbers from NHS England Digital, as well as regional & sociodemographic data from the ONS & the Consumer Data Research Centre (link) to enable us to calculate prescribing rates (total prescriptions per patient).

Regional patterns still exist in antibiotic prescribing
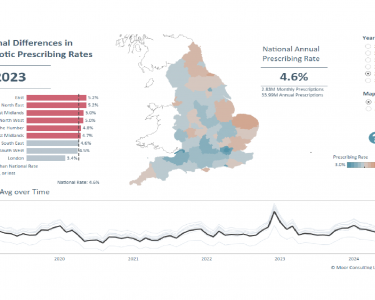
Our analysis shows that the highest prescribing rates for antibiotics are in the North East & North West regions – the North East exhibiting the highest rates across all years 2019-2024, and the East being highest in all years except 2023 & 2024. Meanwhile, the lowest rates are consistently in London, the South West & the South East. Interestingly this mirrors the analysis we performed in 2012 (focused on CCG level data) which showed a north/south difference in prescribing rates, and again London having the lowest prescribing rates.
Drilling down into those regions, at a county level there is a high degree of consistency in prescribing rates with all counties in the North East being consistently above the national average, and only Cheshire in the North West ever dipping below the national average. If drilling down further to areas (as shown when hovering over any county bar) there is a bit more variability, with Manchester & Rochdale in Greater Manchester being always lower then the national average.
At the other end of the scale Greater London can be seen to be more consistent, with Inner London having the lowest prescribing rates across all years, and all of the Greater London boroughs being below the national average, with the exceptions of Sutton, Havering & Bexley in Outer London, which had rates higher than the national average for all years, as well as rates that are considerably higher than all other London boroughs/areas. Within Greater London there is a pattern for area/borough prescribing rates, in that Outer London boroughs tend to have higher rates whilst Inner London have lower rates. Perhaps this is due to population density, or difficulties/waiting times in accessing GP services.
When we 1st looked at antibiotic prescribing rates back 2012, the simple fact that our dashboard & analysis showed there were regional differences caused some comment – not least by Dame Sally Davis (then the Chief Medical Officer for England, and a leading advocate for reducing unnecessary antibiotic use). With the concern that over-prescribing of antibiotics is contributing to the rise of resistant bacteria and so-called ‘super bugs’ we had hoped that the regional differences we saw back then would be less pronounced, but this would appear not to be the case. Various studies have identified different factors that contribute to variations in prescribing rates, both regional & seasonal, such as clinician decision fatigue, clinician mental health, or patient over-reporting of symptoms (link) or high consultation rates for respiratory tract infections and high prescribing rates of corticosteroids (link), or contextural factors such as local collegiate support, regional expectations & information (link). Perhaps with further analysis it would be possible to identify which of these factors contribute to the consistent regional differences seen in our analysis. In lieu of having access to such data, we have instead analysed sociodemographic data, to see if perhaps different strata of English society receive different prescribing rates, and could also provide more information to an overall model explaining variations seen. This is the focus of our next dashboard on antibiotic prescribing: Differences in Antibitoics Prescribing to Society groups
If you’d like to learn more, discuss any potential collaborations, or sign up for our new tiered Moor Rx service, please contact us
Related resources
-

Differences between Society Groups
Do different socio-demographic groups in society receive differing amounts of antibiotics? Are there any patterns to be seen?
-

Impact of Socio-demographic Factors
Which sociodemographic factors have an impact on antibiotic prescribing? How strong are the relationships & in what direction?