Impact of Socio-demographic Factors
Which sociodemographic factors have an impact on antibiotic prescribing? How strong are the relationships & in what direction?
In the previous dashboard we looked at patterns in antibiotic prescribing between society groups, and we found that there are clear & consistent differences. Is it now possible to investigate what could responsible for these differences? Are there specific sociodemographic dimensions that show a relationship with prescribing rates?
The sociodemographic groups we used previously in our analysis were derived by a government backed team from UCL & other academic institutions, using 60 selected dimensions from the 2021 national census, organised in 7 Domains or subject areas:
- Household composition
- Demographic structure
- Religion, Housing
- Employment
- Education
- Health & Wellbeing.
This was building on similar analysis of previous national censuses dating back to 1971. The selection of the 60 dimensions from the total possible of 188 variables from the census data was guided by multiple considerations: maintaining consistency with previous classifications while excluding dimensions made less relevant by societal changes and the COVID-19 pandemic; ensuring comprehensive domain coverage without introducing bias; and incorporating novel dimensions aligned with evolving governmental priorities and societal developments (link).
The 2021 Census Domains & Dimensions

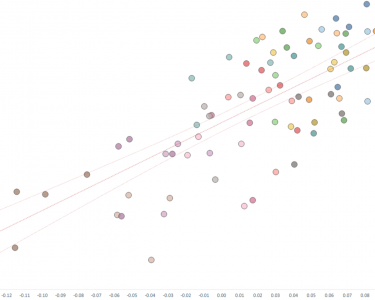
We were able to incorporate the clustering data used in the analysis by accessing a GitHub repository shared by the project’s lead analyst. This dataset included values for each of the 60 census dimensions across all Groups. Because the raw data varied significantly between dimensions, we created a normalized indicator of dimension strength per Group by calculating the percentage variance from the national average. This allowed us to highlight how each Group diverged from the national standard for each dimension. These normalized values were then plotted against the prescribing rate for each Group in a scatter plot. Using this visual representation, we then applied linear regression analysis to assess whether any relationships existed between the census dimension values and prescribing rates.
Linear regression is a statistical method used to understand and quantify the relationship between one factor (the dependent variable, in this case the prescribing rate) and one or more other factors (the independent variables, in our case dimension values). It does this by fitting a straight line through the data that best explains the trend, allowing you to make predictions or assess the strength and direction of relationships. So, in this situation should the line point upwards it implies that an increase in the dimension value is associated with an increase in the prescribing rate, and if pointing downwards it suggests suggests that lower dimension values are associated with higher prescribing rates. Beyond this simplistic explanation, there are two key variables within a linear regression model: the P value which indicates whether the model is statistically significant (or whether or not the observed model could just be a result of random chance or not), and R^ or R-squared, which indicates the strength of the relationship, should the model be statistically significant (for more explanation) – as R-squared represents the percentage (or proportion) of dependent variable (the prescribing rate) values that can be explained by the influence of the independent variable (the census dimension values). However, one aspect of linear regression analysis that needs to be noted is that whilst it can establish if a relationship exists, and identify the direction and strength of any relationship, and even be used to predict values, its can not be said to define causality – it is purely a measure of correlation.

From our analysis we can see that of the 60 dimensions, 45 dimensions exhibit statistically significant linear regression @ 95% confidence – that is to say that we have 95% confidence that an actual relationship is evident, and not due to pure chance or a ‘normal distribution’ of events. Of these, 24 can be seen to have a moderate to strong relationship with prescribing rates (R-squared over 0.4) of which 10 have a positive relationship (increasing strength of the dimension being associated with increased prescribing), and 14 a negative relationship (the dimension being associated with a decrease in prescribing). Looking for more robust relationships, 7 dimensions can be said to have a strong relationship with prescribing rates (R-squared over 0.7), of which 4 are positive & 3 are negative in respect to prescribing rates. The two dimensions with the strongest relationships are Private Rented from the Housing Domain (positive relationship) and Aged 4 and under from the Demographic structure Domain (negative relationship), both with a high R-squared score of 0.83, with the other strong relationships being: Process, plant, and machine operatives, Families with no children, and Part-time employment (all positive relationships) – and then Born in an EU country, and Born in a non-EU country (both negative).
What does this tell us?
Whilst we can not say that any of these dimensions have a causal relationship with prescribing, we can use them to predict prescribing rates with varying degrees of confidence and have the potential to use them in any more involved model of prescribing behaviour (or a related subject), or in more in-depth investigations. With the present level of data we have we could easily expand this analysis to include more granular regional data & see how the two strands combine to impact prescribing rates across the country. Also, within these dashboards we have at present only looked at antibiotic prescribing – however as consequence of our data gathering, we have data on all GP practice prescribing, both of medicines & medical devices – and the approaches we have shown in respect to antibiotics could very easily be expanded or focused on any particular area of interest.
Building on the idea of using this analysis as a stepping stone to more involved analysis & models of prescribing, one obvious area would be incorporating it into AI based machine or deep learning models, as often linear regression is undertaken as one of the 1st steps in building & defining a ML or DL model. This is something we are currently exploring internally, and hope to share with the world in the future.
In researching this subject area, we came across several academic articles investigating secondary factors & their impact on or relationship to antibiotic prescribing rates. Examples of this include investigating links between prescribing rates & comorbidities, this time using clinical prescribing date from America (link), and an investigation into societal drivers of regional differences in prescribing rates in Germany (link), but we didn’t find any other analysis focusing on sociodemographic factors as we have here. This suggests a new paradigm of analysis, one which would also lend itself to various different focus areas, both commercial (for example market research & pharmaceutical marketing, market modelling, product development & positioning) and non-commercial (academic, public health communications such as health education & risk communication, health policy, public behavioural policy) – and again, as mentioned above could very easily be applied to other therapy areas and both medicines & medical devices.
If you’d like to learn more, discuss any potential collaborations, or sign up for our new tiered service to use these & other dashboards, please contact us
Related resources
-

Differences between Society Groups
Do different socio-demographic groups in society receive differing amounts of antibiotics? Are there any patterns to be seen?
-

Regional Antibiotics Prescribing
Are there regional differences in antibiotics prescribing? Are there consistent patterns across different years?
-

Moor Rx
A new service from Moor Consulting providing both advanced & self service analytics of prescribing data