Differences between Society Groups
Do different socio-demographic groups in society receive differing amounts of antibiotics? Are there any patterns to be seen?
Since the 1971 the government has used data collected as part of each decade’s national census to build a socio-demographic categorisation of the population, grouping together areas based on the people that live in them, rather than geography. This categorisation has then been used by policy makers across all maner of socio-political subjects. In the most recent census, a team of analysts from UCL, the University of Liverpool & Homes England performed k-means clustering on a set of 60 variables from the census to create a hierachical taxonomy of socio-demographic groups (Wyszomierski, J., Longley, P.A., Singleton, A.D., Gale, C. & O’Brien, O. (2023))
Building on the regional analysis of antibitoic prescribing we have incorporated the top two tiers of this hierarchy to see if there are patterns of prescribing based on socio-demographic factors, rather than just regional. The highest level of clustering is comprised of 8 ‘Super-Groups’ which each comprised of between 5% to 20% of England’s patients, and are then broken down into 21 more granular Groups with the largest (‘Ageing Communities’) accounting for 11% of patients & the smallest (“Routine Occupations or Retirement”) accounting for less than 1% of England’s patients.

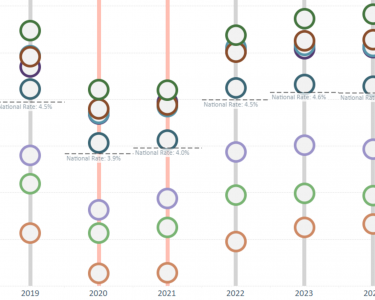
At the top level of the sociodemographic classification, the ‘super Groups’ are highly consistent in their prescribing rates with no change in ranking between the groups across the 6 years. Low Skilled Workers which makes up about 13% of national patients exhibits the highest prescribing rates across all years (an average of 4.9%), while Multicultural Educated Urban which accounts for 7.3% of patients always has the lowest prescribing rates (an average of 3.5% across all years). During the COVID years, the prescribing pattern again remained constant with the same order of the groups as seen in other years (Low Skilled Workers highest, then Legacy Communities, Suburban, Retired, Baseline UK, Ethnically Diverse Suburban, Low-Skilled Migrant & Students, and finally Multicultural Educated Urban lowest), and all Super Groups’ prescribing rates dropping by an average of 0.7%.
When looking at the more granular Groups (21 groups which comprise the 8 Super Groups) there is again a high degree of consistency, even if there is some variation: the groups hold their ranking across most of the six years, and even when movement does occur its only by one or two positions in the ranking table. For example, the highest ranking group Young Families in Industrial Towns has the highest prescribing rates in all years except 2023 (an overall average of 5.0%), while the lowest ranked Student Living & Professional Footholds maintains the lowest prescribing rates for all years (an overall average of 3.2%).
Its also worth noting that whilst there can be apparently small differences in prescribing rates between Groups, due to the large sample sizes these differences are still statistically significant. For example, the two Groups with the highest prescribing rates – Young Families in Industrial Towns and Spacious Rural Living – have prescribing rates of 5.36% & 5.24% in 2019, and then 5.30% & 5.08% in 2024. Whilst these seem to be close, because the two groups have around 1.5 million and 1.3 million patients each, these apparently close proportions in fact display a statistically significant difference (ie they can not be said to be explained by chance alone).
The statistically significant differences between groups, combined with the high degree of consistency over six years, suggest that sociodemographic factors influence prescribing rates – even though the individuals in these groups are the recipients of prescriptions rather than the prescribers. This highlights the need for a deeper investigation into the census dimensions used by the government-sponsored team to create the Super Group and Group classifications, and how these relate to prescribing patterns – and is the focus of our next dashboard on antibiotic prescribing: Impact of Sociodemographic Factors on antibiotic prescribing
If you’d like to learn more, discuss any potential collaborations, or sign up for our new tiered Moor Rx service, please contact us
Related resources
-

Regional Antibiotics Prescribing
Are there regional differences in antibiotics prescribing? Are there consistent patterns across different years?
-

Impact of Socio-demographic Factors
Which sociodemographic factors have an impact on antibiotic prescribing? How strong are the relationships & in what direction?